
Data
See how your protection performs
Sales, take-up, claims and commission, live in your portal and ready to share.
For retailers, brands and platforms that offer protection.
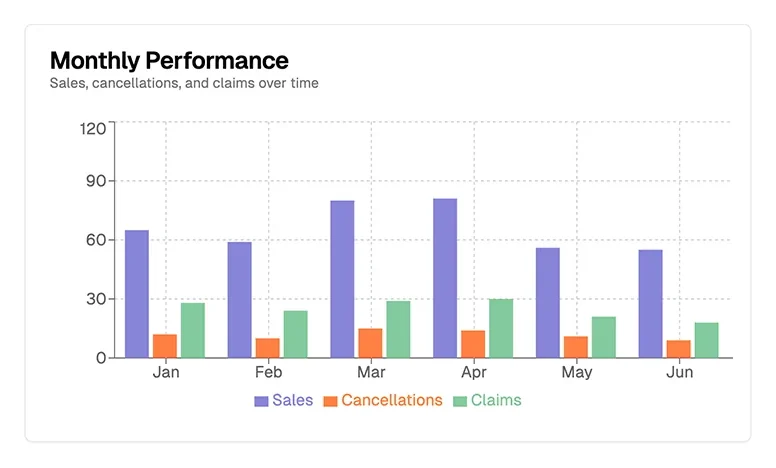
Track your commission and your claims, and share them.
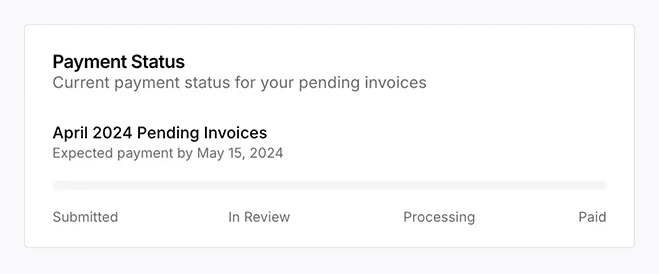
Invoices and commission
The commission you invoice us and what’s been paid, kept in step by AI-powered reconciliation, with the full history.
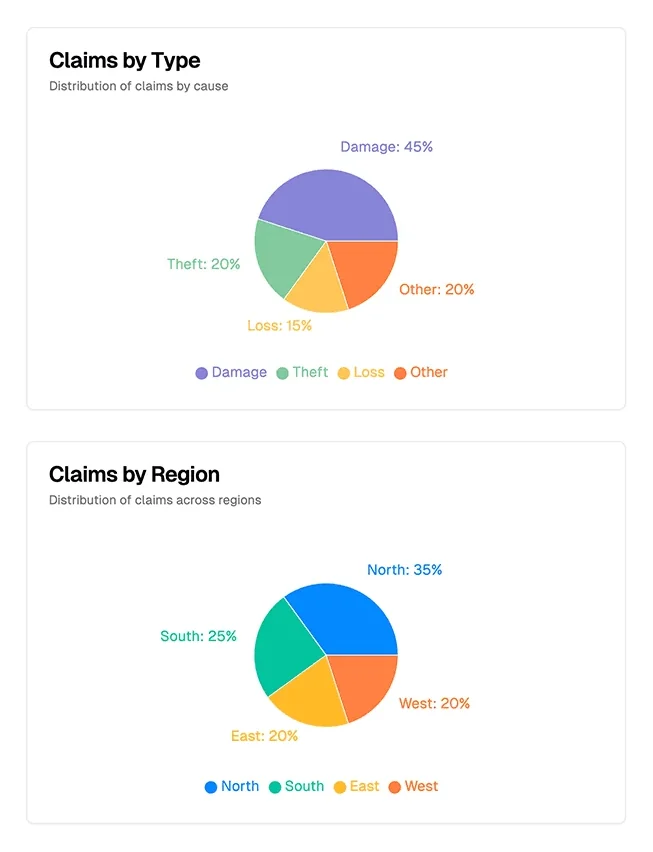
Claims, broken down
Claims by type and by region, so you see where things go wrong.
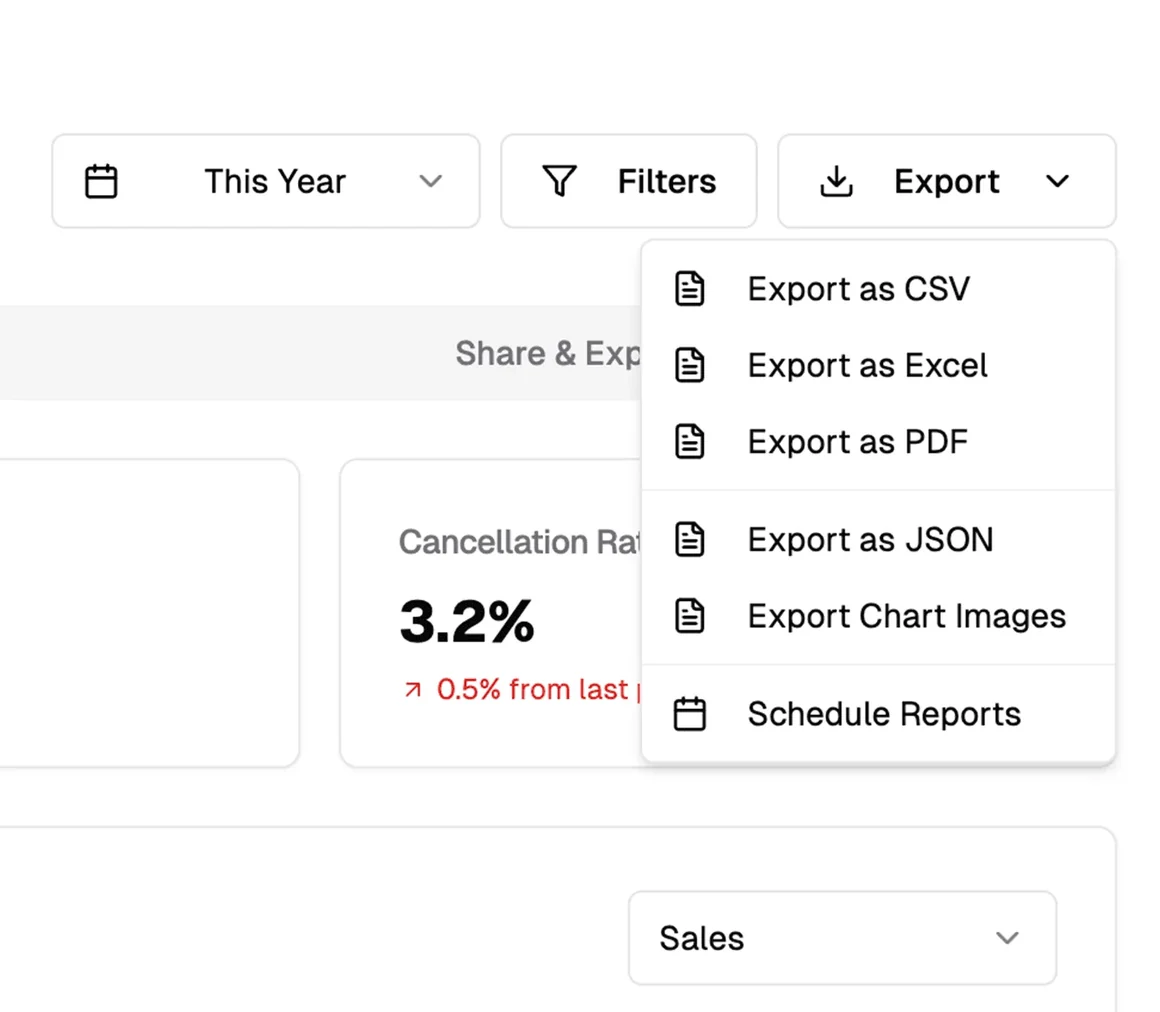
Take it with you
Export any view to CSV, Excel or PDF, schedule a report, or connect your own tools by API.
Questions, answered
What do we see at a glance?
Sales, take-up, active policies and cancellations, by month and by product, without waiting for a report.
How soon does a new policy show?
As soon as it’s sold: cover starts within seconds, and the policy shows in your portal.
Can we share them?
Yes. Export any view, schedule a report for your team, or connect your own tools by API.
Continue exploring
- ConfigurationProtection designed around your products: the cover, the price, your branding and the documents your customers get, all in your portal.
- IntegrationSell protection your way: a journey we host, plugins for Shopify and Magento, your own checkout on our API, or AI assistants such as ChatGPT.
- AdministrationEvery policy your customers take out, in one place: its customer, its cover, its status and every change, in your portal.
- ClaimsYour customers report a claim online and we handle it quickly, repairing before we replace. You follow every claim in your portal.